What is BMI Chart? How to Use BMI Chart Australia?
BMI Chart is one of the most functional tables for people who want to control their body mass index values. Having a healthy body, you should have some health conditions such as a normal BMI value. Well, what is BMI chart? How BMI chart for females to be read? What do BMI Chart colors mean?What is BMI Chart?
The Body Mass Index chart is a colored table to analyze people’s body mass index in weight, height, age, and gender parameters. Using and carrying a Body Mass Index table in your bag will help you to control your body and life better.What Do BMI Chart Colors Mean?
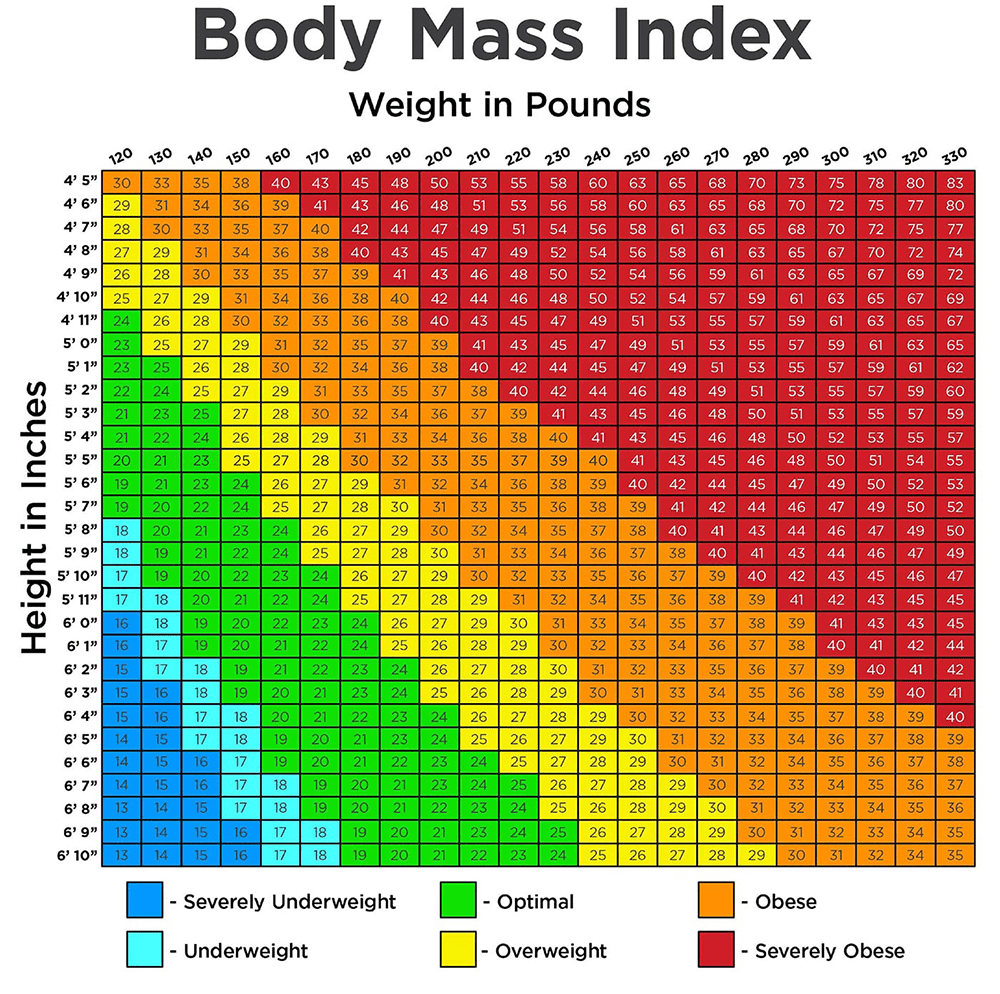
Blue: The blue color in the table says that your result is under the expected weight-body ratio. Therefore, you should be fatter than now.
Green: If your BMI calculation has resulted in the green box interval, you are normal. In other words, you can continue to your life how you live now. You don’t need to change your lifestyle or eating habits according to your BMI calculation results.
Yellow: The yellow boxes warn you to be a little bit careful. If you don’t control your life anymore, you can take more fat which may lead to having an unhealthy body.
Orange: The orange parts in the BMI chart show that you should take advice from a doctor or dietician for having a healthy living condition. According to your doctor’s advice, you may need to apply a special diet or change your lifestyle.
Red: The red part of the chart warns people to reorganize their lives critically. Due to the urgency of the situation is so critical. People whose BMI results are in the red part should stop doing everything and control their life carefully with the partnership of a dietician.

How Do I Calculate My BMI Index?
If you don’t know how to calculate BMI, you can use the Australian BMI calculator on this website easily. The BMI calculator kg cm tool gives you chance to see whether you are in the normal body mass index or not. Then, you can analyze your BMI report according to the BMI chart female and BMI chart men. Making BMI calculations manually is also easy for you. For analyzing your body mass index state, you should use the formula in the following:BMI : Body weight / Height x Height (in Meters)
What is the Normal Range for BMI?
The answer for what is a healthy BMI is shown in the metric Body Mass Index chart for adults. When you use a BMI calculator kg tool for analyzing the last state of your body, you can control your life better. In addition, the printable BMI chart for adults can be used wherever you are not only in Australia.What is a Healthy BMI in Kg in BMI Chart?
A healthy BMI in kg in the Body Mass Index chart is showed as 18.5 and 24.9 intervals. In other words, your BMI report should be resulted in between 18.5 and 24.9 values. If you are not in this interval, there are some unexpected situations in your life.What Should My BMI Be Australia?
Wherever you live, your BMI report should be resulted in the interval of 18.5 and 24.9 values to have a healthy body mass index. The BMI chart shows how close or far your results are from normal. If you live in Australia, you can also use the BMI calculator NSW tool and the BMI Chart Australia on this website.
Is There a Special BMI Chart for Males or a BMI Chart for Females?
The BMI Chart female image is the same as for males. In other words, there is not a special female BMI table or BMI chart for males. However, you should choose your gender at the beginning of the form called BMI calculator kg.Advertising & Sponsored links
Advertising & Sponsored links